Web Log Analysis Tutorial |
Lesson 1 : Getting Started with Nihuo Web Log Analyzer
Dear [firstname],
Welcome to the Web Log Analysis Tutorial of Nihuo Software.
You are listed on the Web Log Analysis Tutorial subscriber list and if you wish to have your name removed from this list, use the unsubscribe link below.
Table of Contents
- Introduction
- Download and install
- Creating your 1st analysis task
- Web Log Format
- Related learning resources
- Unsubscribe

I. Introduction
This tutorial is your starting point for learning web log analysis. It shows you some of the things you can discover about your visitors through analysis of your web site logs. It uses Nihuo Web Log Analyzer Windows version to provide examples of reports, but the knowledge gained can be applied to Nihuo Web Log Analyzer Linux version and any other traffic analysis tool.
II. Download and install
If you have not downloaded Nihuo Web Log Analyzer, please download and
install the latest version from
http://www.loganalyzer.net/download.html, before proceeding with this
tutorial.
III. Creating your 1st analysis task
1. Where can I find my IIS log files?
To determine where your IIS log files are stored, please follow below guides step by step on your server:
- Go to Start -> Control Panel -> Administrative Tools
- Run Internet Information Services (IIS).
- Find your Web site under the tree on the left.
- If your server is IIS7
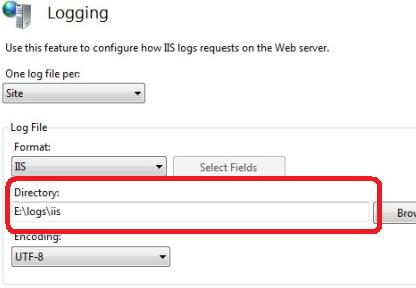
- Click Logging icon on the right
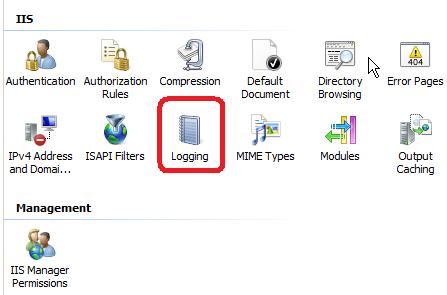
- On the bottom of logging page, you will see a box that contains
the log file directory
- Click Logging icon on the right
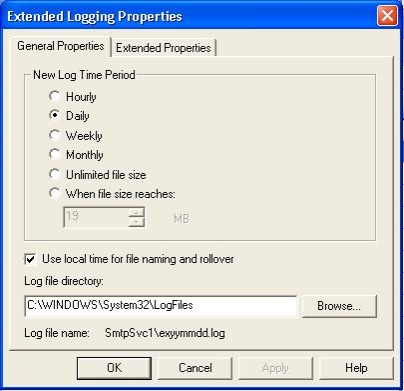
- If your server is IIS 6
- Right-click on it and choose Properties.
- On the Web site tab, you will see an option near the bottom that
says "Active Log Format" Click on the Properties button.
- At the bottom of the General Properties tab, you will see a box
that contains the log file directory and the log file name.
2. Where can I find my Apache access log files?
The location and content of the access log are controlled by the CustomLog directive. Default apache access log file location:
- RHEL / Red Hat / CentOS / Fedora Linux Apache access file location - /var/log/httpd/access_log
- Debian / Ubuntu Linux Apache access log file location - /var/log/apache2/access.log
- FreeBSD Apache access log file location - /var/log/httpd-access.log
To find exact apache log file location, you can use grep command:
- grep CustomLog /usr/local/etc/apache22/httpd.conf
- grep CustomLog /etc/apache2/apache2.conf
- grep CustomLog /etc/httpd/conf/httpd.conf
Sample output:
CustomLog "/var/log/httpd-access.log" common
CustomLog "/var/log/httpd-access.log" combined
3. How to create my first analysis task?
Please visit online flash step by step tutorial in http://loganalyzer.net/log-analysis-tutorial/creating-project.html.
IV. Web Log Format
It is critical to set up your web server logging in a format that allows Nihuo Web Log Analyzer to properly interpret the data and produce fully detailed reporting.
 |
1. ApacheBy default, Apache generally logs in what's called common log format, and also provides an option to log in a more detailed format known as NCSA extended/combined log format. For optimal reporting, Nihuo strongly recommend the NCSA extended/combined format. NCSA custom log format can be analyzed by Nihuo Web Log Analyzer too. |
2. Microsoft Internet Information Server (IIS)Nihuo Web Log Analyzer can provide very basic reporting if your IIS log
files have, at the very least, the following fields:
|
 |
However, this minimal logging does not provide enough information for Referral and Browser reporting. Therefore it is advisable to set more detailed logging properties for your IIS server.
For more detail report, please export following fields in your IIS log files:
|
 |
V. Related learning resources
VI. Unsubscribe
If you do not wish to receive any further Web Log Analysis Tutorial, please click: Unsubscribe
For more information or other questions please contact us at [email protected].
Thank you for taking the time to read the Web Log Analysis Tutorial. We wish you continued success!
Warmest regards,
Nihuo Software Team